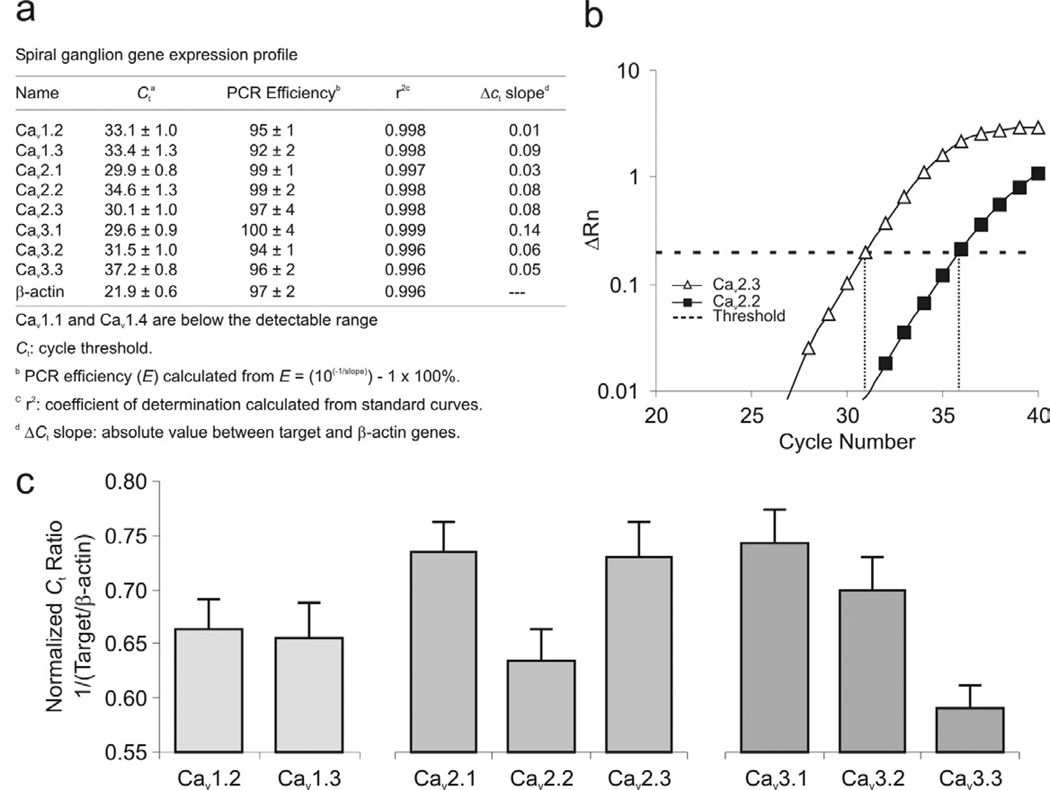
Figure 1.
VGCC α-subunit transcript expression levels in the spiral ganglion. (a) Survey of relative mRNA levels of Cav α-subunits. (b) An example of real-time qRT-PCR amplification of Cav mRNA transcripts shows a higher expression of Cav2.3 than Cav2.2. (c) Normalized Ct ratio (to housekeeping gene β-actin) of L-type, P/Q-, N-, R-, and T-type Cav subunits. Experiments were performed using 3 separate extractions (n = 3).

