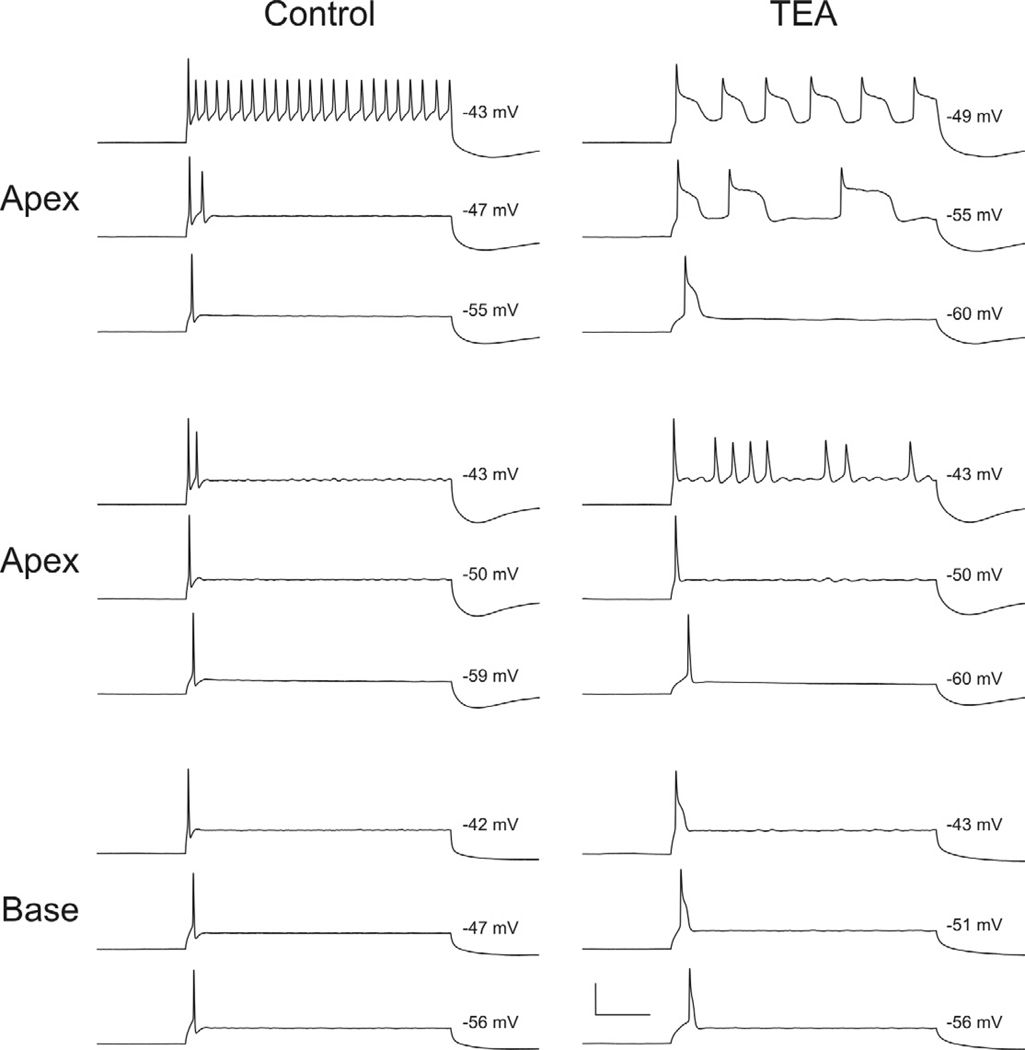
Figure 3.
Apical neurons display differential responses to TEA application. Whole-cell current clamp recordings before (Control) and after (TEA) exposure to TEA from two different apical neurons (top and middle panels) and one basal neuron. Responses are shown for threshold (lowest traces) and suprathreshold levels (middle and upper traces) for each of the three neuronal recordings. Values at the right of each trace are measured (estimated; top panel, upper traces) from the plateau potentials resulting from a prolonged constant current injection (240 ms). Of the total number of recordings made from apical, middle, and basal spiral ganglion neurons, only two apical neurons showed and absence of Ca2+ spikes (middle panel).

