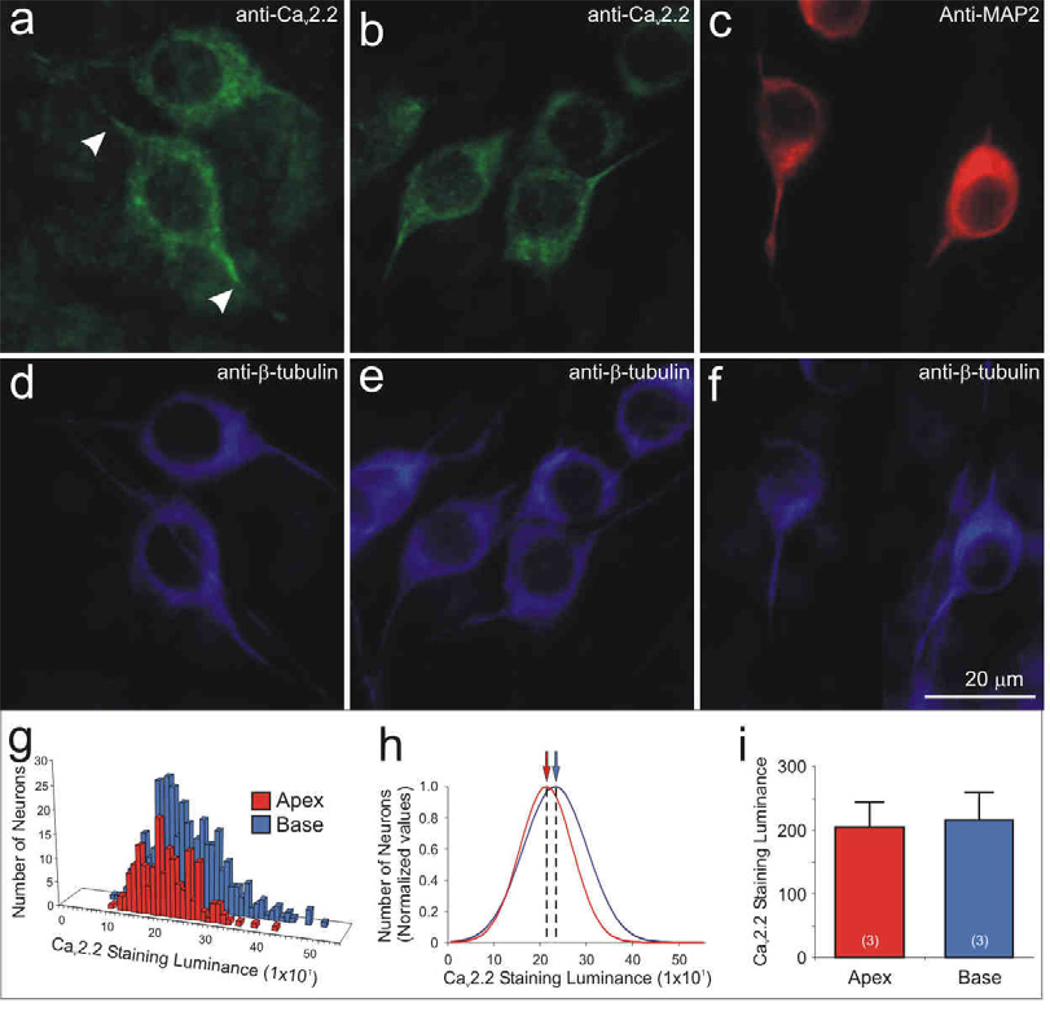
Figure 6.
The Cav2.2 α-subunit was uniformly distributed within apical and basal neurons, yet showed an unique intracellular pattern, similar to that observed for MAP2 labeling. Anti-Cav2.2 α-subunit antibody (green) labeling showed similar staining intensity in (a) apex and (b) neurons. The intracellular distribution, however, was distinctive because labeling of the somata extended for restricted distances into the initial regions of the processes (a, arrowheads), despite observations that the processes labeled with anti-β-tubulin antibody extended well beyond that point (d), often for hundreds of microns (not shown). (c) Neurons labeled with anti-MAP2 (red) showed a similar intracellular labeling pattern observed with anti-CaV2.2, such that enriched labeling was confined to the soma and initial processes. (d–f) Anti-β-tubulin antibody (blue) was used as a neuron-specific marker showing that the length of the processes extended beyond anti-CaV2.2 and anti-MAP2 immunolabeling. Neuronal measurements of anti-CaV2.2 luminance were illustrated by (g) representative histograms and (h) normalized Gaussian distributions for a single experiment. (i) Averaged Cav2.2 staining luminance (n = 3) showed that anti-Cav2.2 antibody luminance was similar between the two regions. Calibration bar in panel f applies to a–f.

