
Figure 3.
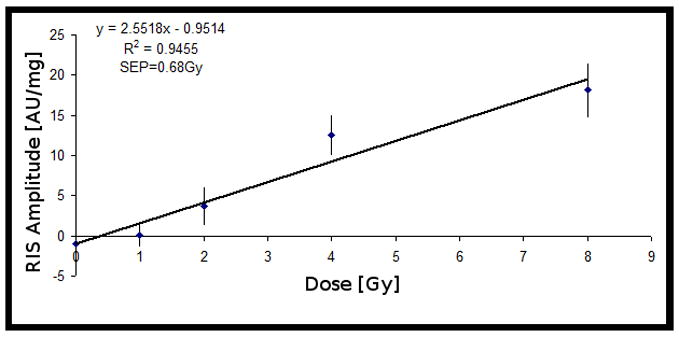
Dose-response from Set B (10 sets), where the value of C from Set A (20 sets) was used to relate the MIS singlet and the MIS broad component. The signal intensities were normalized to sample mass. Error bars represent SEM.
Official websites use .gov
A
.gov website belongs to an official
government organization in the United States.
Secure .gov websites use HTTPS
A lock (
) or https:// means you've safely
connected to the .gov website. Share sensitive
information only on official, secure websites.
Dose-response from Set B (10 sets), where the value of C from Set A (20 sets) was used to relate the MIS singlet and the MIS broad component. The signal intensities were normalized to sample mass. Error bars represent SEM.