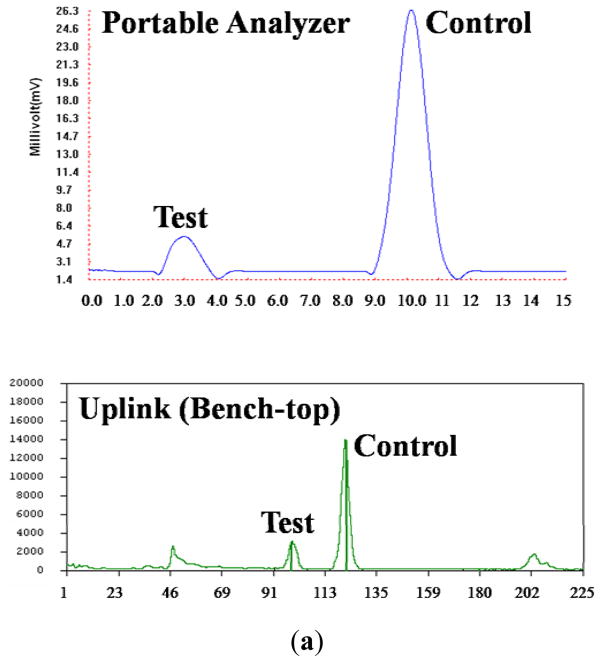
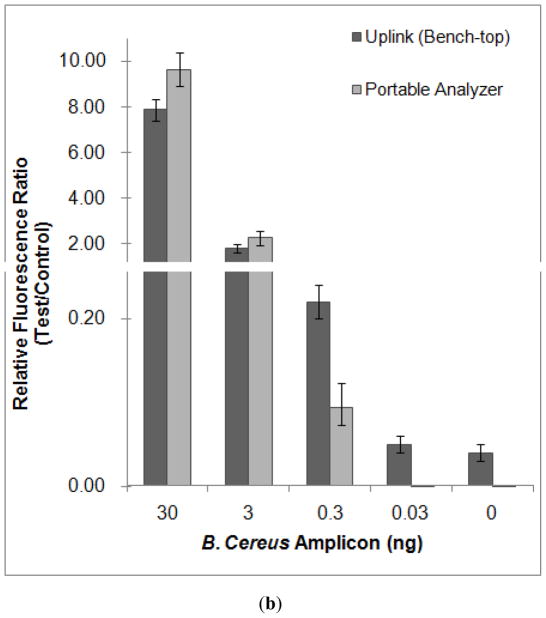
Fig. 6.
(a) Emission intensity, as a function of position along the strip (scan result), of a 0.3 ng haptenized DNA sample obtained with the portable analyzer (top) and with the benchtop UPLink reader (bottom). (b) The ratio between the area of the test peak and the area of the control peak as a function of the target analyte’s mass. The dark black and gray bars correspond, respectively, to results obtained with the benchtop UPLink instrument and with the portable analyzer. The error bars indicate the scatter of the data (n=3).


