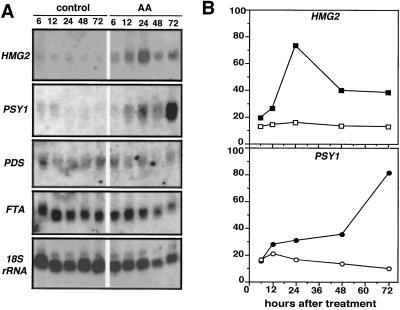
Figure 4.
RNA-blot analysis of gene expression in control and AA-treated mature fruit. Mature-green fruits were injected with 10 μL of a control solution or 5 μg/μL AA solution while attached to the plant. Groups of three to five fruits were collected and ground together after 6, 12, 24, 48, or 72 h. A, RNA-blot analysis of total RNA extracted from the different fruit pools. The blot was hybridized with a gene-specific HMG2 probe, and other probes from tomato PSY1, PDS, and FTA. An 18S rRNA probe was used to compare the RNA amounts loaded in each lane. B, Quantification of the steady-state levels of HMG2 and PSY1 mRNA. Open symbols, Control fruit; closed symbols, AA-treated fruit. The values shown are normalized with the 18S rRNA amounts and are expressed relative to the level detected in red, firm fruit.

