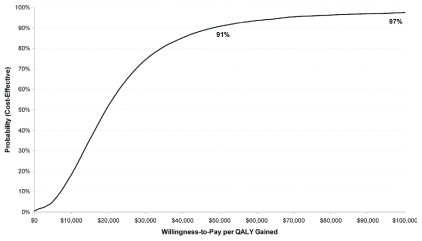
FIGURE 4.
Cost-effectiveness acceptability curve. The x axis shows willingness-to-pay per quality-adjusted life year (qaly) gained in Canadian dollars; the y axis shows the probability that docetaxel– cyclophosphamide (tc) is cost-effective. The likelihood that tc is cost-effective is shown at various thresholds of willingness-to-pay per qaly gained; the probabilities are, respectively, 91% and 97% that tc is cost-effective at the commonly applied thresholds of $50,000 and $100,000 per qaly gained.

