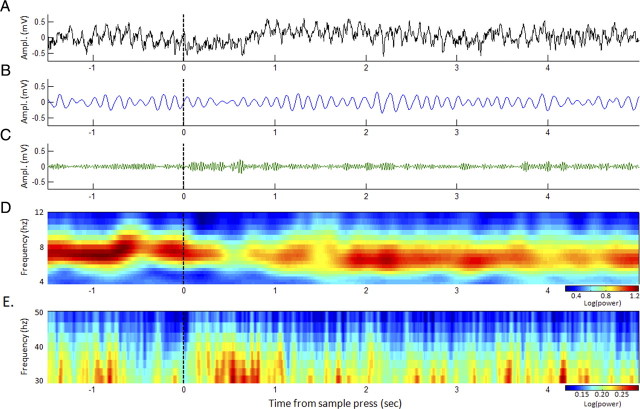
Figure 5.
Dynamic oscillations during real-time performance. A, Example of CA1 EEG recorded during the beginning of a DNMS trial (dashed line indicates the moment of the sample lever press). B, C, The same data are shown filtered in the 4–12 Hz theta band (B) and in the 30–50 Hz gamma band (C). D, E, Averaged power spectrogram over all completed trials (N = 45) in a session by one rat (including the trial in A) are also shown for frequencies in the theta band (D) and gamma band (E). Spectrograms were averaged within frequency bands in each trial to produce dynamic traces for the analyses in Figures 6–8.

