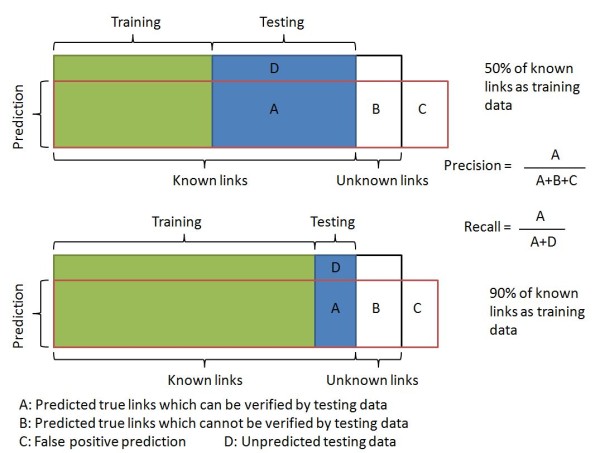
Figure 8.

Demonstration of TF-Gene regulatory links data. The prediction (the area in red line) includes a part of the training data, a part of the testing data, a part of currently unknown links and some false positive predictions. When the percentage of known links as training data increases, since more training data is used, at the same recall level, the false positive decreases, and the precision (portion of area A in the area A+B+C) decreases.
