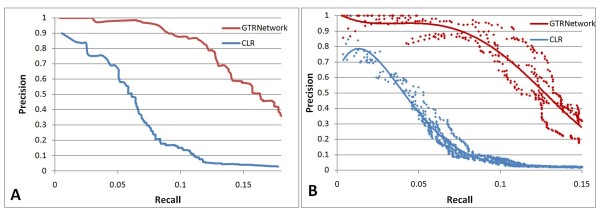
Figure 9.
Comparison between GTRNetwork and CLR on E. coli data. (A) Precision-recall curve of testing results of GTRNetwork and CLR algorithms using transcriptome data from M3D database [36] and the input training TF-Gene topology of the full set of RegulonDB 7.0 [34]. (B) Precision-recall plot of testing results of GTRNetwork and CLR algorithms using transcriptome data from M3D database [36] and the input training TF-Gene topology of 50% links randomly knocked out RegulonDB 7.0 [34] data. Five random replications are applied on the test. The precision and recall are calculated based on the testing data of the knocked out RegulonDB 7.0 [34] on each replication respectively. The trend lines are fitted by polynomial functions.

