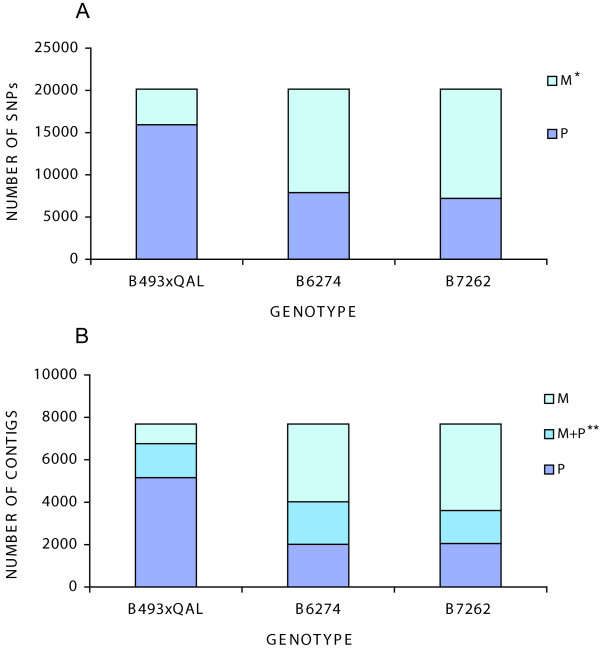
Figure 4.
Intra and inter-sample SNP distribution. Intra- and inter-sample polymorphism distributions of computationally detected SNPs within carrot genotypes (B493xQAL, B6274 and B7262) at a depth of sequence coverage of 20 or more. The two graph reports: (A) distribution of intra and inter-sample polymorphism SNPs within genotypes; (B) distribution of intra and inter-sample polymorphism SNP within genotypes and contig containing SNPs. * M = intra-sample monomorphic, inter-sample polymorphic; P = intra- and inter-sample polymorphic. ** M+P = contigs containing both P and M SNP categories.

