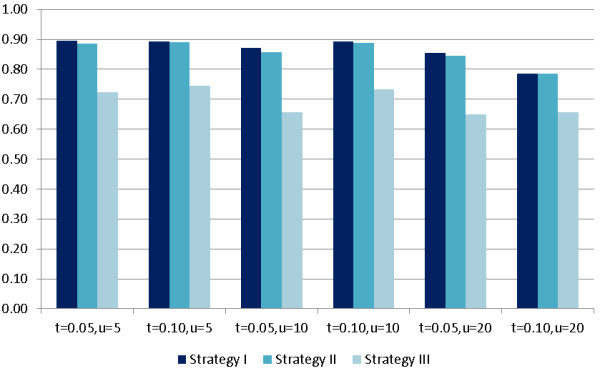
Figure 2.

Impact of different thresholds on power. The effects of different truncation thresholds t = 0.05 or 0.10, and different sizes of regions 11, 21, or 41 (i.e. u = 5, 10, or 20) on power (y-axis). Only Scenario (B) (three causal SNPs) is considered, and the minor allele frequency is set to 0.50.
