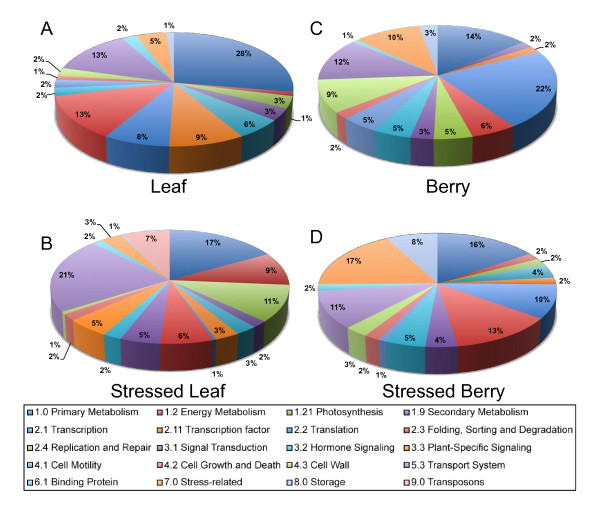
Figure 3.
Functional categories of differentially expressed transcripts identified by EST frequency analysis. Functional assignments of genes found in the four major clusters of differentially expressed genes. At the chosen hierarchy depth / distance, the four clusters correspond, in large part, to maximal frequencies within A) Leaf, B) Stressed Leaf, C) Berry, and D) Stressed Berry cDNA libraries. Assignments are based upon the data available at VitisNet http://www.sdstate.edu/aes/vitis/pathways.cfm[93]. Chart colors progress clockwise from the top.

