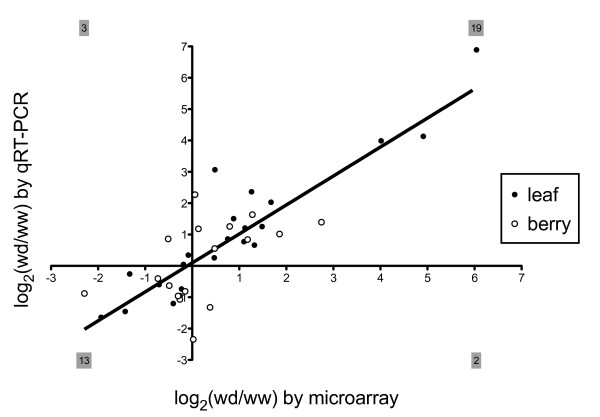
Figure 5.
Expression of stress-related genes in V. vinifera leaves and berries as detected by microarray and qRT-PCR. Log2-transformed values of Affymetrix® Vitis GeneChip® signal intensities (x-axis) and real time-RT-PCR expression log2-ratios (y-axis) of 22 genes in leaf tissue (filled circles), as well as 17 genes in berry tissue (open circles) of water deficit (wd) and well watered (ww) vines. A linear regression has slope m = 0.92 and Pearson correlation r = 0.85 for the total data set of 39 pairs of log2-ratios [10,24]. The totals of genes present in each Cartesian quadrant are shown in gray-shaded boxes. qRT-PCR data were derived from three biological replicates.

