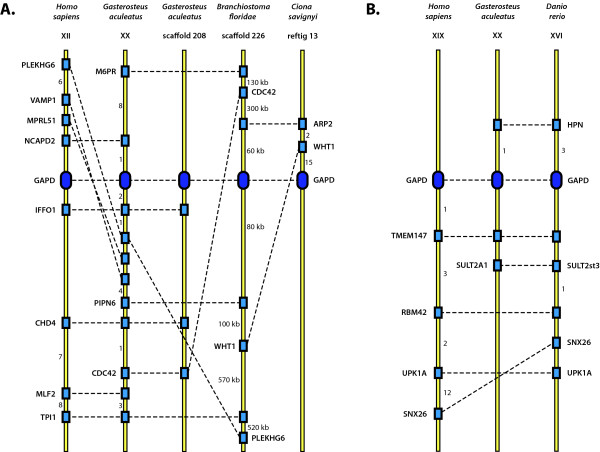
Figure 4.
Synteny maps. Syntenic comparison of GAPD genes among human (Homo sapiens), stickleback (Gasterosteus aculeatus), zebrafish (Danio rerio), lancelet (Branchiostoma floridae) and sea squirt (Ciona savignyi). A) The locus containing GAPD-1 of human, GAPD-1 of stickleback, GAPD-3 of stickleback, the only GAPD isoenzyme of lancelet and one of GAPD isoenzymes of sea squirt. B) The locus containing GAPD-2 of human, GAPD-2 of stickleback and GAPD-2 of zebrafish. GAPD genes are shown by ovals, other genes - by rectangles. Homologues are indicated by discontinuous lines. The numbers near the yellow axes mean either the quantities of genes which are not shown or the distances in kilobases.

