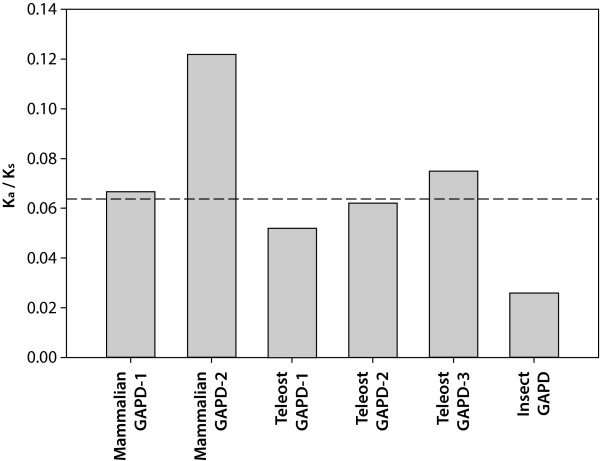
Figure 6.
Ka/Ks values obtained with the aid of branch-specific models. The shown Ka/Ks values were calculated using the six-ratio (R6) model, which implies different selection constrains for GAPD-1 and GAPD-2 of mammals, GAPD-1, GAPD-2 and GAPD-3 of teleosts, as well as GAPD of insects. The values for all isoenzymes except mammalian GAPD-2 and insect GAPD were found not to differ significantly. Discontinuous horizontal line is the Ka/Ks value obtained using the one-ratio (R1) model, which implies the same selection constrains for all isoenzymes.

