Figure 2.

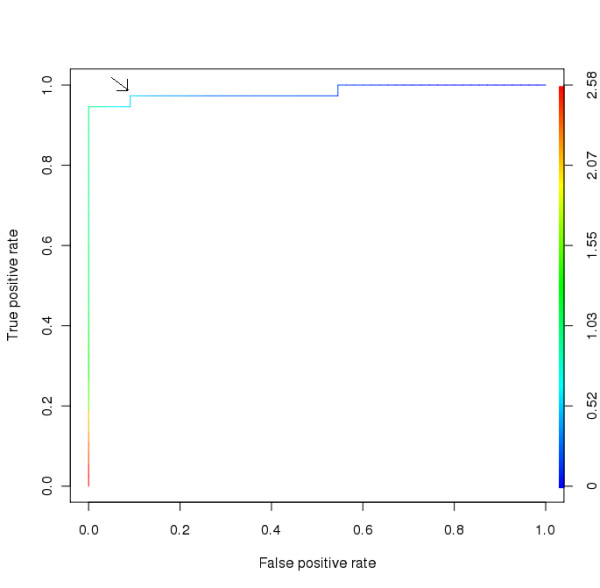
Receiver operating characteristic curve. The selected optimal threshold value (marked by arrow) for "FungalRV adhesin predictor" is shown.

Receiver operating characteristic curve. The selected optimal threshold value (marked by arrow) for "FungalRV adhesin predictor" is shown.