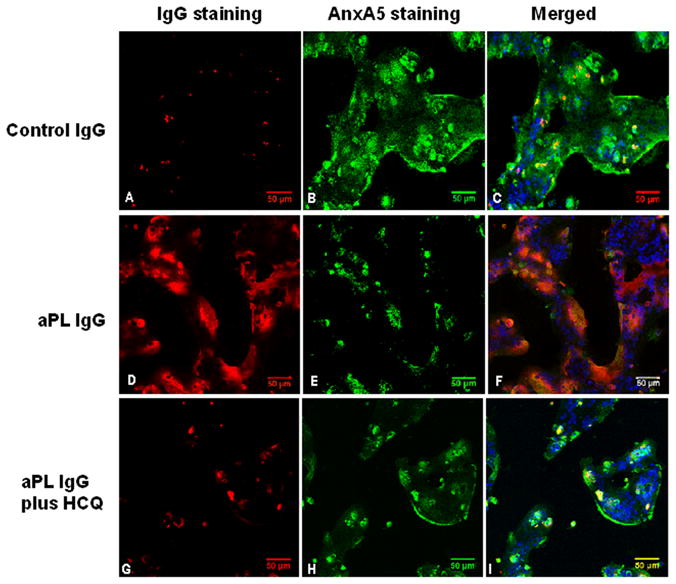
Figure 1. Effects of HCQ on polyclonal aPL IgG binding and AnxA5 expression on cultured SCTs.

Representative images of three-channel laser confocal microscopy show that in the absence of HCQ, cells treated with polyclonal control IgG showed A) very little bound-IgG (red fluorescence) and B) normal expression of AnxA5 (green fluorescence). Cells treated with polyclonal aPL IgG showed D) a large amount of bound-IgG (red fluorescence) and E) markedly reduced expression of AnxA5 (green fluorescence).
Treatment with 1μg/ml of HCQ G) reduced the amount of bound-aPL IgG and H) increased the expression of AnxA5 on the cells. Addition of HCQ to the polyclonal control IgG-treated cells had no discernible effect (data not shown). C, F and I show merged images of green (FITC), red (rhodamine) and blue (DAPI) fluorescence marking AnxA5, IgG and nuclei, respectively. [bars = 50 μm. Confocal microscopy 3-dimensional projections of Z-axis image stacks, voxel size (μm): width 0.73, height 0.73, and depth 1.50]
