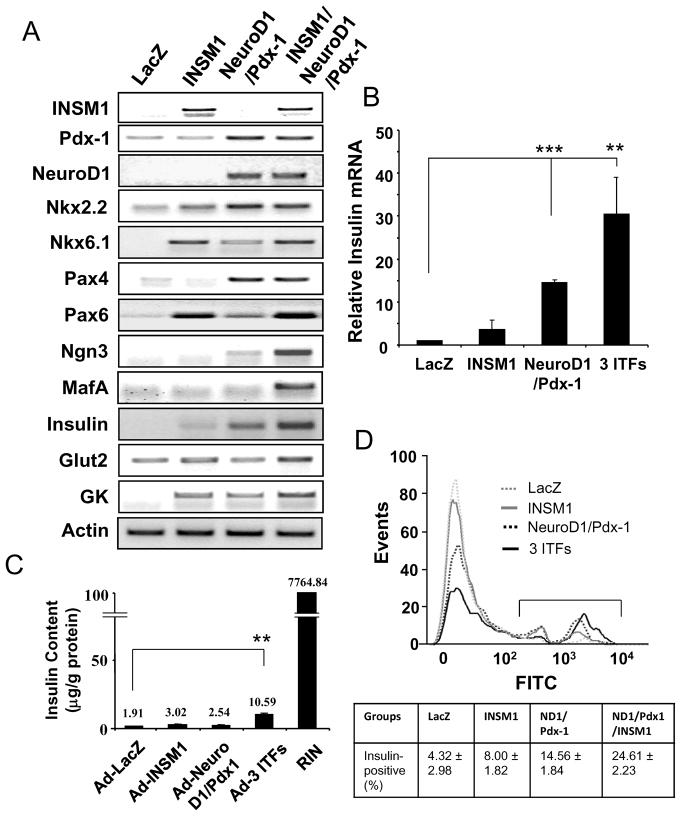
Fig. 2. ITF expression patterns with the addition of the three ITFs, Ad-INSM1, Ad-Pdx-1, and Ad-NeuroD1.
(A) Adenoviral vectors including control Ad-LacZ were added to the AR42J cells (m.o.i.=40:1) for 72 h. RT-PCR measurements of insulin, Nkx2.2, Nkx6.1, Pax4, Pax6, Ngn3, MafA, Glut2, and GK, mRNA expression levels from the four different treatment groups. Actin was used as an internal control. (B) Insulin RNA levels were quantified by real-time PCR. The p values represent **<0.01 and ***<0.001. (C) Insulin content. Four treatment groups and RINm5F cells were subjected to insulin content (μg/g protein) measurement using ELISA. (D) Flow cytometric analysis of insulin-positive cells. The insulin stained cells were labeled with FITC and subjected to flow cytometric analysis using FlowJo software. Percentage of insulin-positive cells is shown in the box below.

