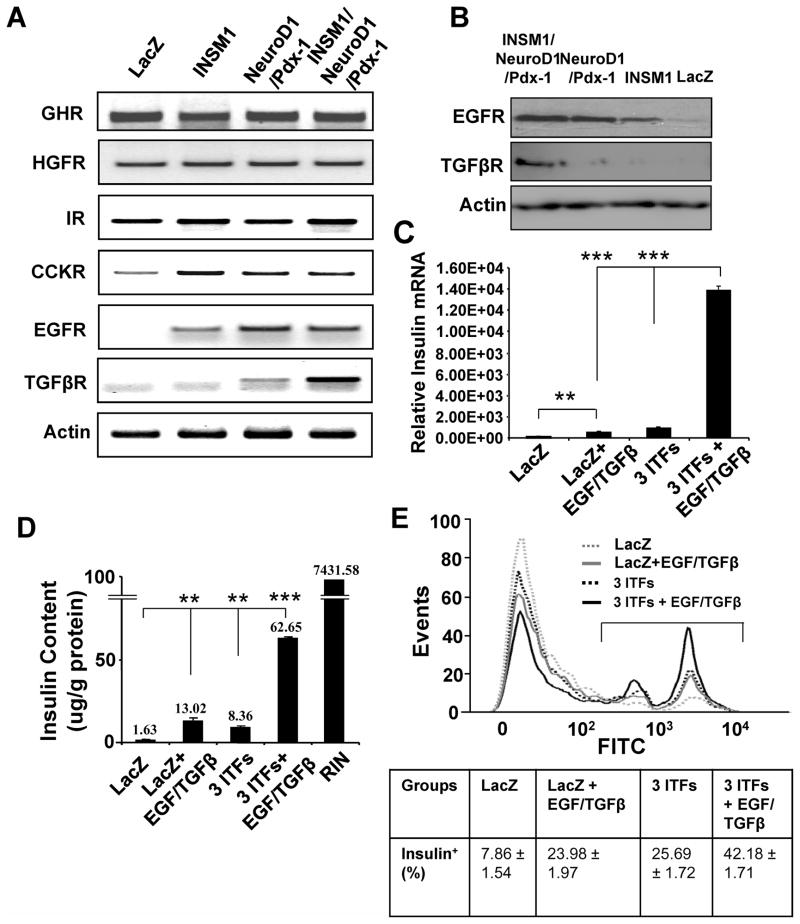
Fig. 5. ITFs combined with EGF/TGFβ enhance insulin expression.
(A) RT-PCR shows elevated levels of EGFR and TGFβR in the three ITFs induction group. (B) EGFR and TGFβR protein were detected by Western blot analysis. (C) Quantitative RT-PCR analysis of insulin message from LacZ, LacZ + EGF/TGFβ, 3 ITFs, and 3 ITFs + EGF/TGFβ. The p values represent as **<0.01 and ***<0.001. (D) Insulin content. The above four treatment groups were subjected to insulin content analysis using ELISA and expressed as μg/g protein using RINm5F cells as the control. (E) Flow cytometric analysis of insulin-positive cells. The insulin-positive cells were labeled with FITC and subjected to flow cytometric analysis using FlowJo software. The percentage of insulin-positive cells is shown in the box below.

