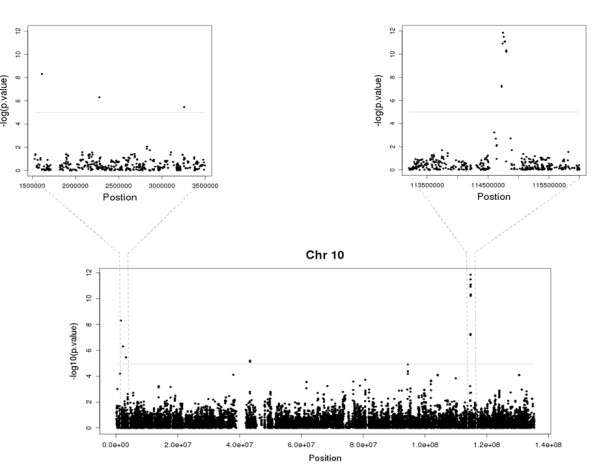
Figure 6.
Local patterns of association as predictor of accurate imputation. On the lower graphic, a graphical representation highlights markers that could be considered associated to the phenotype under study using a significance threshold of 10 -5. On the higher left and right panel, a highlighted representation of regions with concordant (right) and discordant (left) associations.

