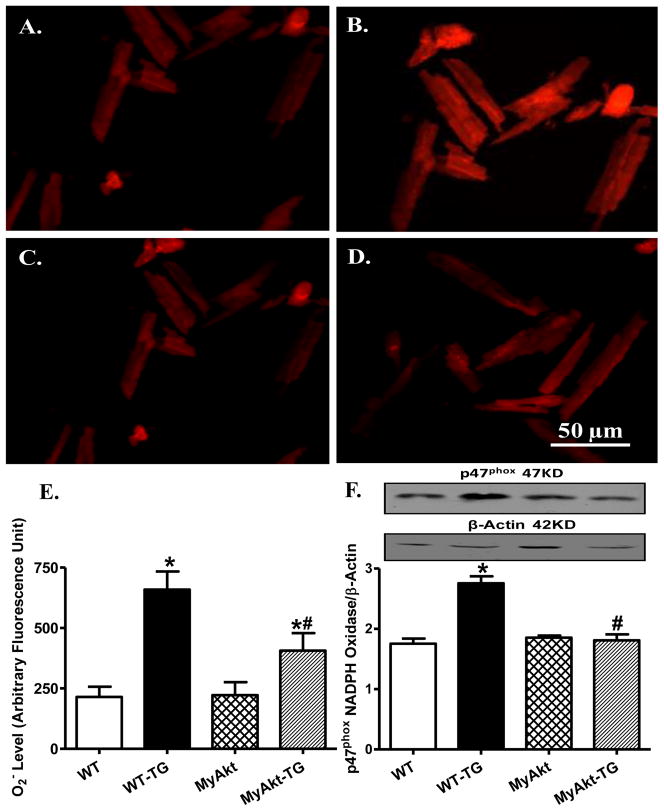
Fig. 5. Effect of ER stress on superoxide (O2−) production and NADPH oxidase.
ER stress was induced with in vivo thapsigargin challenge (3 mg/kg, i.p., 48 hrs) before O2− production and p47phox subunit of NADPH oxidase were evaluated by DHE fluorescence and western blot, respectively, in myocardium from adult WT and MyAkt mice. A–D: DHE fluorescence images depicting O2− fluorescence intensity from WT (A), WT-TG (B), MyAkt (C) and MyAkt-TG (D) groups; E: Quantified data displaying O2− fluorescent intensity from 8 fields; and F: p47phox expression; Inset: Representative gel blots depicting p47phox and β-actin (loading control) using specific antibodies; Mean ± SEM, n = 5–7 mice per group, * p < 0.05 vs. WT group; # p < 0.05 vs. WT-Thapsigargin (TG) group.

