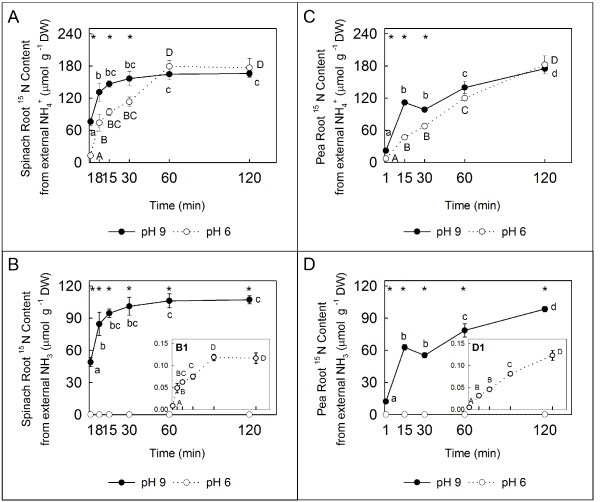
Figure 4.
Root 15NH4+ and 15NH3 contents calculated from the total 15N uptake. 15N content accumulated from 15NH4+ absorption (μmol g-1 DW) in spinach (A) and pea (C) plants. 15N content accumulated from 15NH3 absorption (μmol g-1 DW) in spinach (B) and pea (D) plants. (B1 and D1) Magnified portions of plots (B and D respectively) showing the 15N content that accumulated as a result of external 15NH3 absorption at pH 6 (μmol g-1 DW). The partitioning between NH3 and NH4+ has been calculated using the Henderson-Hasselbalch equation (see Additional file 2). Data represent the average values ± SE (n = 3). Letters represent significant differences (P ≤ 0.05) during exposure to pH 6 (A, B, C and D) and pH 9 (a, b, c and d). An asterisk (*) denotes significant differences between pH 6 and 9 (P ≤ 0.05).

