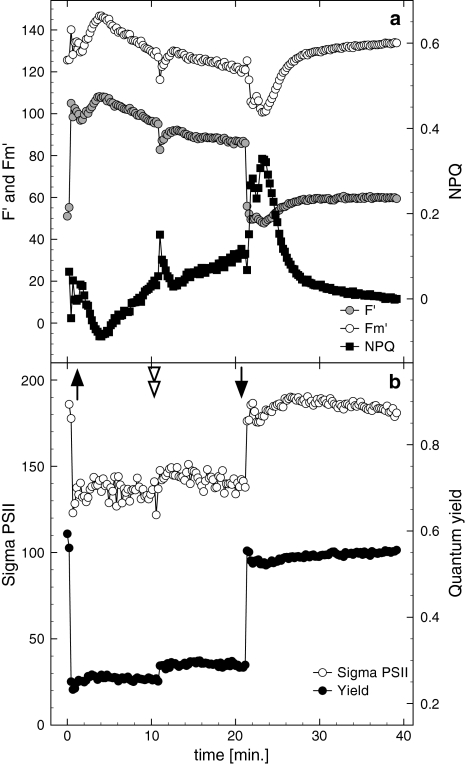
Fig. 2.
Representative fluorescence parameters measured by FRRF during a dark to light transition using a single irradiance intensity (‘block light treatment’) and darkness. a F′, F m′ on the primary ordinate, and NPQ on the secondary Y-axis; b σPSII (Sigma PSII) and maximal quantum yields as well as effective quantum yields during the irradiance treatment. The upward arrow indicates the start of the light period using a photon flux of 440 μmol photons m−2 s−1 (approx. 4 × growth light intensity) after dark incubation (1–2 h). The downward arrow indicates the end of the light treatment. An addition of 160 μM dissolved inorganic carbon aimed for detection of nutrient depletion (double arrowhead), which should not have occurred due to low cell densities in this experiment. Results were confirmed in two independent experiments

