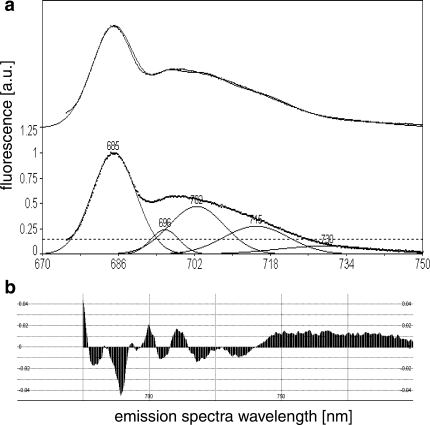
Fig. 4.
Representative fluorescence emission spectrum measured at 77 K (a) and residuals remaining after de-convolution (b). A minimum of three measurements per sample were averaged and baseline corrected. The fit was forced through peaks at 685 nm (light harvesting compounds of PSII), 695 nm (PSII reaction core), 702 nm (origin not clear), 715 nm (PSI) and 730 nm (PSI, or vibration). Top curve: dots data points, line resulting fit from de-convolution. Although the origin of the F 702 is obscure, leaving it out resulted in poor fits. Spectra were normalised to F 658 nm. Residuals (b) show the quality of the fit and remained below 0.05 for all samples analysed. Emission peak height data were used for PSII/PSI ratio (F 685/F 715 nm). Excitation wavelength was 435 nm

