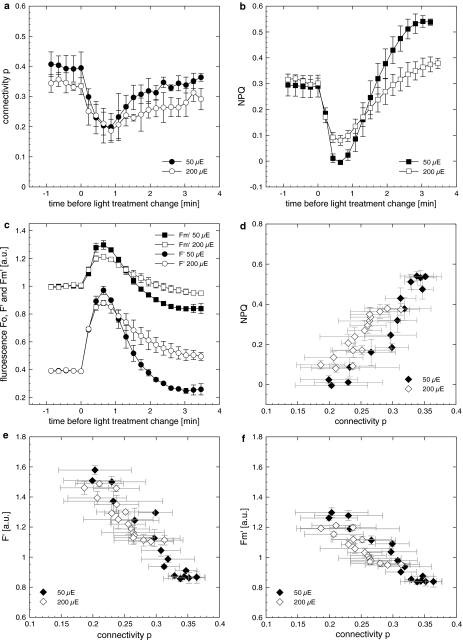
Fig. 9.
Connectivity p (a), NPQ calculated using the Stern–Volmer equation ((F m − F m′)/F m′) (b) and F’, F m′ (c) during the first minutes of the dark–light transition and the following higher irradiance treatment. Data were extracted from Fig. 3 (i.e. the experiment, where cells were exposed to consecutive increasing photon fluxes) and rearranged for better comparison. Filled symbols show the first light treatment, open symbols the following irradiance step. Numbers in the legends refer to the photon flux [closed symbols (50 μE) = 50 μmol photons m−2 s−1; open symbols (200 μE) = 200 μmol photons m−2 s−1]. Please note that data from the first and second light increment are plotted on the same timeline for improved comparability. d A positive correlation between NPQ and p, while correlations were negative for F′ (e) and F m′ (f). F′ and F m′ in (e, f) have also been normalised to values prior to light treatment. Changes on the Y-axis therefore depict the relative change of F′ and F m′, which explains why F′ values can be higher F m′. Correlation coefficients were stronger (r 2 ≥ 0.88) in cells exposed to the first light increment (closed symbols) compared to the higher irradiance in the second light step (open symbols, r 2 ≤ 0.61). For readability reasons F′ has been normalised to 0.4 and not 1 in (c). Data show mean and SD (n = 3)

