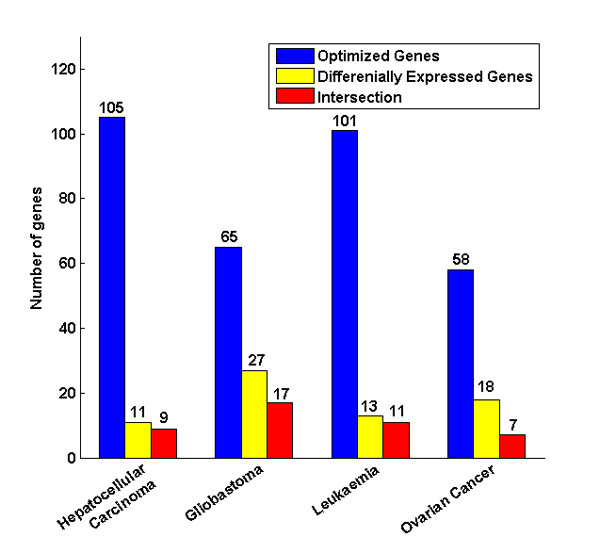
Figure 7.

Comparison of the optimized genes and the differentially expressed genes. Four types of cancers, hepatocellular carcinoma, glioblastoma, leukemia, and ovarian cancer are on the x axis. The y axis represents the number of genes. The optimized genes are blue and the differentially expressed genes are yellow; the intersection between optimized genes and differentially expressed genes is red.
