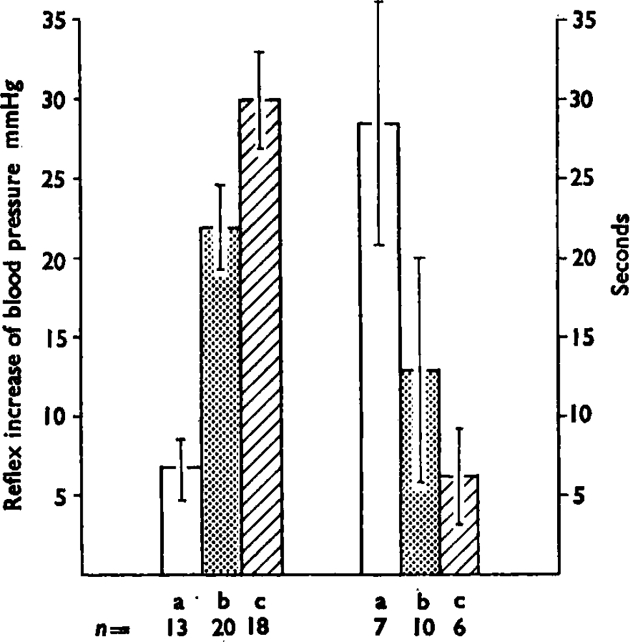
Fig. 3.

The histogram shows the mean (± s.e.m.) maximum increase in blood pressure (left hand group) and the mean (+ s.e.m.) delay time in seconds to the start of the response (right hand group) induced by intrasplenic injection of three dose ranges of bradykinin; (a) is 0·05–0·1 μg, (b) is 0·2–1 μg and (c) is 2–10 μg. Numbers under the bars (n) are number of experiments. As the doses increase, the pressor effect increases and the delay decreases. The mean values are calculated using the reciprocals of the delays to overcome the difficulty of infinite delays when there was no response to a given dose. Lines show standard errors of the means.
