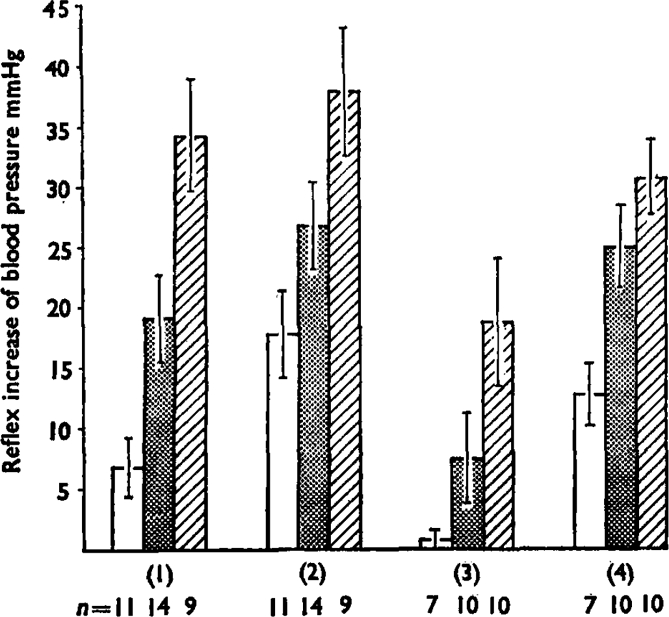
Fig. 7.

This summarizes the reflex pressor increases in blood pressure produced by bradykinin injections at 0·1 μg (open bars), 0·5 μg (stippled bars) and 2 μg (hatched bars). Numbers of experiments (n) are shown below. Group 1 are the mean increases (+ s.e.m.) for control injections and group 2 shows the potentiation produced by simultaneous injection (5–20 μg) or infusion (50–200 ng/min) of prostaglandin E1. Differences between the effects of bradykinin (by paired t tests) had P values of <0·01 for 0·1 μg, <0·02 for 0·5 μg, and <0·l for 2 μg. Group 3 shows the reduced effects of bradykinin after dosage of the does with indomethacin (1–5 mg/kg i.v.) and group 4 shows the potentiation of these effects by prostaglandin E1. The differences were all significant at P<0·01. Groups 1 and 2 were paired observations in the same animals, as were groups 3 and 4.
