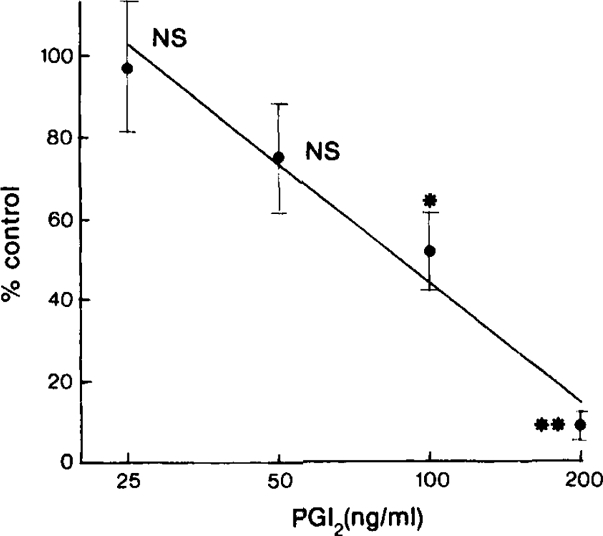
Figure 2.

Inhibition of adenosine diphosphate (ADP)-induced thrombus formation in electrically damaged arterioles (40 to 80 μm) by increasing concentrations of prostacyclin (PGI2) infused into the Krebs solution superfusing the hamster cheek pouch microcirculation. Inhibition is measured as a reduction in total thrombus time (see text) compared with control values. Each point is the mean of 4–7 experiments and the bars represent ± 1 s.e. mean. The straight line was fitted to the log dose-response curve by regression analysis. There is a highly significant linear regression (P > 0.001) and there is no significant deviation from linearity. NS, P > 0.01; *P < 0.0025, **P < 0.0005.
