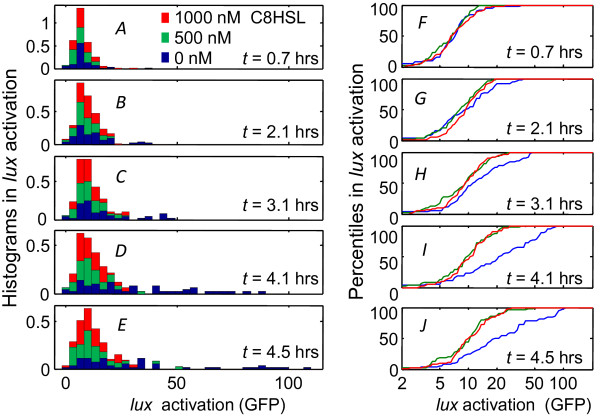
Figure 5.

Temporal response of the lux activation histogram. (A)-(E) Progression of the GFP expression histogram for individual cells in the microfluidic chamber, as measured for the three signal combinations indicated as Experiment #1 (i.e. 100 nM 3OC6HSL and variable C8HSL) in Figure 4B; (F)-(J) Percentiles in gfp fluorescence of individual cells under different HSL conditions. Each curve shows the cumulative area under the corresponding histogram in panels (A)-(E) (and with the same color scheme). In the absence of C8HSL the distribution broadens (and increases in mean value) over 3-4 hrs, while the presence of C8HSL suppresses this response.
