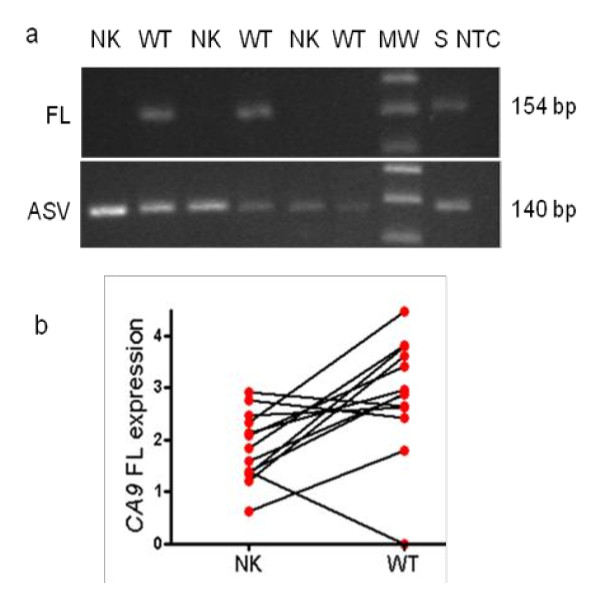
Figure 1.
a) RT-PCR analysis of CA9 isoforms in paired non-tumoral kidneys (NK) and Wilms tumours (WTs). Upper panel: CA9 full length (FL), (154 bp using primers h7S-8A), Lower panel: CA9 alternative splice variant (ASV) (140 bp using primers h7S-h10/7A). Stomach (S) was used as a positive control for both FL and ASV CA9. No test control (NTC). b) The mean relative expression of CA9 FL in 13 matched-paired NK and WTs. Total RNA was extracted from NK and WT samples. Each data point indicates log-transformed relative mRNA expression levels normalised to the lowest expression. CA9 FL expression was significantly higher in WTs than in NKs (p = 0.009). MW = molecular weight marker.

