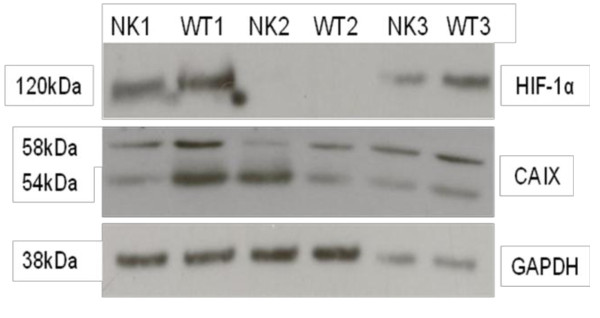
Figure 2.
Protein expression in cell lysates from matched-paired NK and WT samples as detected by western blot analysis. Figure 2a. HIF-1α (upper panel) and CA IX (middle panel) and the lower panel indicates even protein loading as evidenced by detection of the GAPDH control from the same extract. GAPDH is visible as a band of approximately 38 kDa. Upper panel: A single band at 120 kDa indicates full length HIF-1α protein detected in two post-CT samples (pairs 1 and 3). HIF-1α is higher in WTs than in matched-paired NKs. Middle panel: CA IX expression, indicated by two bands of 54 kDa and 58 kDa, is higher in two out of three WTs compared to their corresponding NKs.

