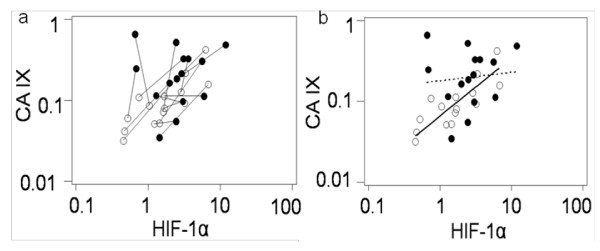
Figure 6.
Relationship between CA IX and HIF-1α protein levels in cell lysates of 15 Wilms tumours (WT) and 15 matched-paired uninvolved kidney (NK) samples as quantified by ELISA. Open and closed circles indicate NK and WT samples, respectively. a) Pairs of results from the same patient are linked. b) Regression lines fitted to the NK (continuous line) and WT (dotted line) samples using a mixed regression model.

