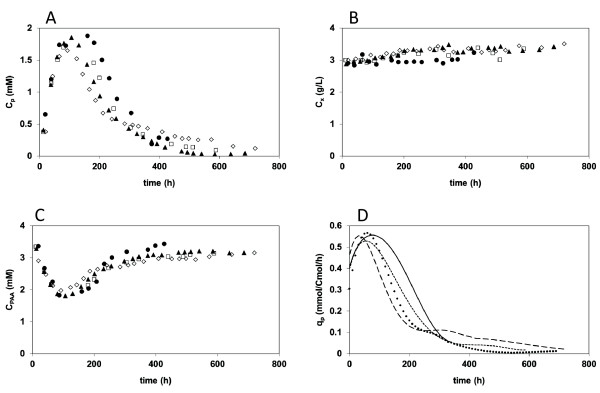
Figure 2.
Time patterns of the concentrations of biomass, PenG, PAA and the biomass specific PenG production rate qp during ethanol limited chemostat cultivation. (A) PenG, (B) biomass and (C) PAA concentrations in chemostat 1 (filled circles), 2 (open squares), 3 (filled triangles) and 4 (diamonds) and (D) biomass specific PenG production in chemostat 1 (solid line), 2 (small stripes), 3 (dots) and 4 (large stripes).

