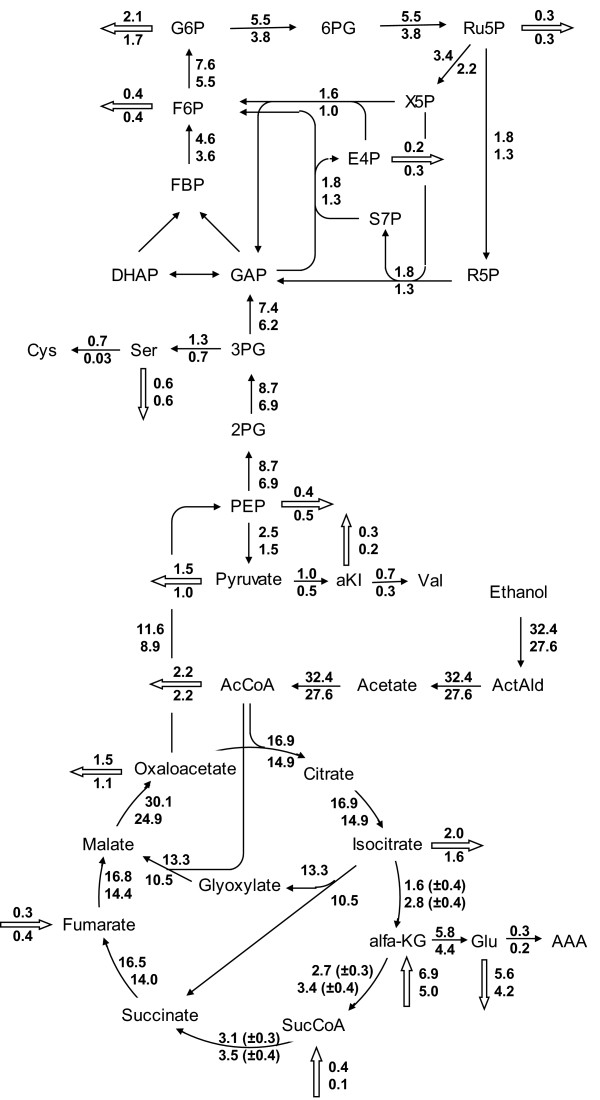
Figure 3.
Calculated flux distribution in the central metabolism of P. chrysogenum, assuming pseudo steady-state. The numbers next to the arrows represent the average flux of chemostat 3 and 4 in mmol/Cmol/h at the penicillin production peak (t = 75 h, upper number) and the degenerated culture (t = 500 h, lower number). The direction of the arrow indicates the direction of the flux. Not all fluxes in the network are shown. The standard errors of the fluxes shown are smaller than 5% unless indicated otherwise.

