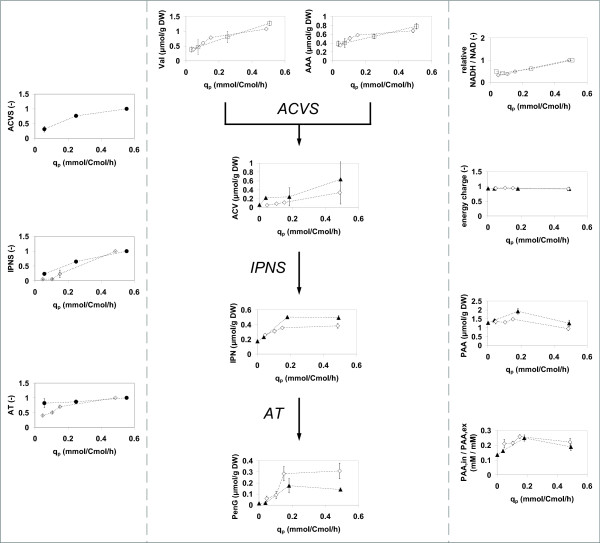
Figure 8.
Levels of proteins and metabolites associated with PenG production, plotted against the specific penicillin production qP. Left panel: Relative protein amounts of the enzymes of the penicillin biosynthesis pathway (see Figure 1) compared to the reference condition at the penicillin production peak (first time point) in chemostat 1 (filled circles) and chemostat 4 (open diamonds). Middle panel: Intracellular levels of penicillin precursors and intermediates in chemostat 2 (open squares), chemostat 3 (filled triangles) and chemostat 4 (open diamonds). Right panel: Energy charge, calculated ratio of NADH/NAD from the Mannitol6P/F6P sensor reaction, intracellular PAA and the concentration ratio of PAA in chemostat 2 (open squares), chemostat 3 (filled triangles) and chemostat 4 (open diamonds).

