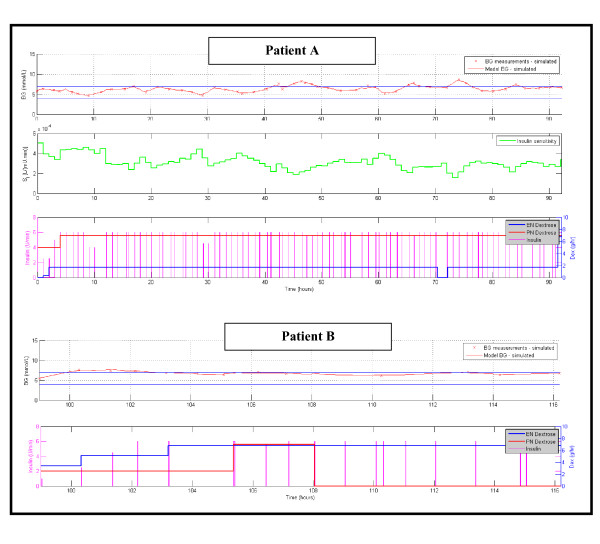
Figure 3.
Patients A and B, glycemic outcomes with STAR (top panel) and interventions (bottom panel). Patient A shows (middle panel) the model identified insulin sensitivity (SI(t), see Appendix (Additional File 1) for details). For BG, the "x" symbols are measured BG values and the solid line is the modeled value. The straight horizontal lines in the BG plots are at 4.0 and 7.0 mmol/L defining that range between them.

