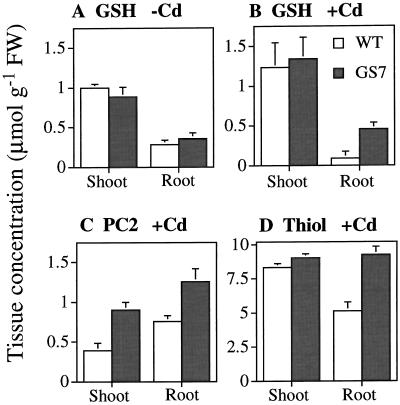
Figure 6.
Tissue concentrations of glutathione (A and B), PC (PC2, C), and total thiol (D) in wild-type (WT) and GS-overexpressing (GS7) Indian mustard plants grown in the absence (A) or presence (B–D) of 0.1 mm CdSO4. Note that tissue PC2 levels in the absence of Cd were below the detection limit in all of the samples. Values shown are the average and se of three replicate samples from four plants each. A, No significant differences between line GS7 and the wild type. B, P < 0.05 for roots, not significant for shoots. C, P < 0.05 for roots, P < 0.01 for shoots. D, P < 0.01 for roots, not significant for shoots. FW, Fresh weight.

