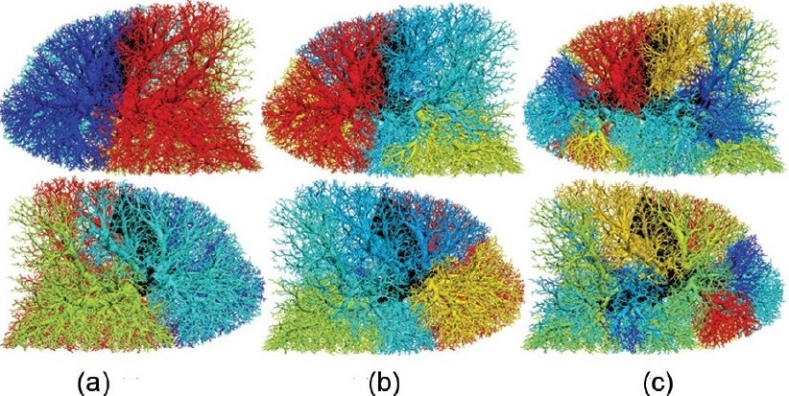
Figure 1.

Visualization of all potential occluded regions for emboli of (a) 10, (b) 7, or (c) 5 mm in radius. Images are oriented in the supine posture and show right (upper panel) and left (lower panel) lung side views. Color range indicates the probability of each occlusion (vessels distal to occlusion have the same color). The color spectrum ranges from most likely (red) to least likely (dark blue) occlusion (ranges: 0.31 to 0.19, 0.19 to 0.014, and 0.059 to 0.011 for 10, 7, and 5 mm emboli). Non-occluded, central vessels shown in black. Flow solution is obtained in the supine posture at FRC.
