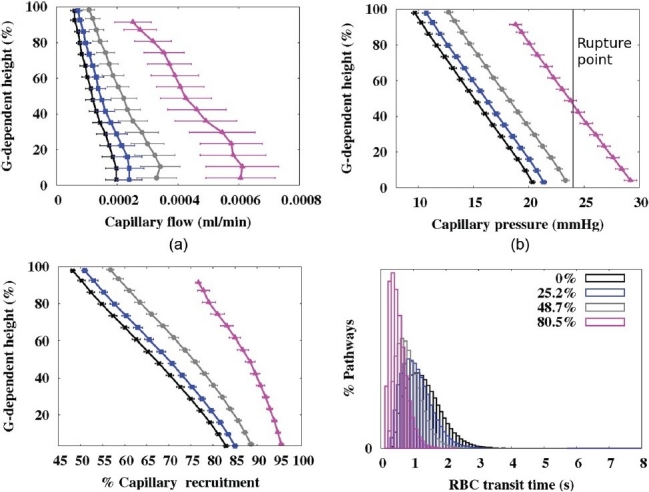
Figure 3.

Micro-circulatory results at different levels of occlusion (0%, 25.2%, 48.7%, and 80.5%) with emboli 10 mm in radius. (a) Capillary flow rate (ml/ min.), (b) capillary pressure (mmHg), (c) % capillary sheet recruited. Each plot displays mean values in 10 mm isogravitational slices plotted with respect to gravitationally-dependent lung height (dorsoventral axis, %). In (b) the pressure (~24 mmHg) when the blood gas barrier may start to become compromised35 is included. (d) RBC transit time distribution for each occlusion level. All occluded capillary ‘sheets’ were removed from this analysis.
