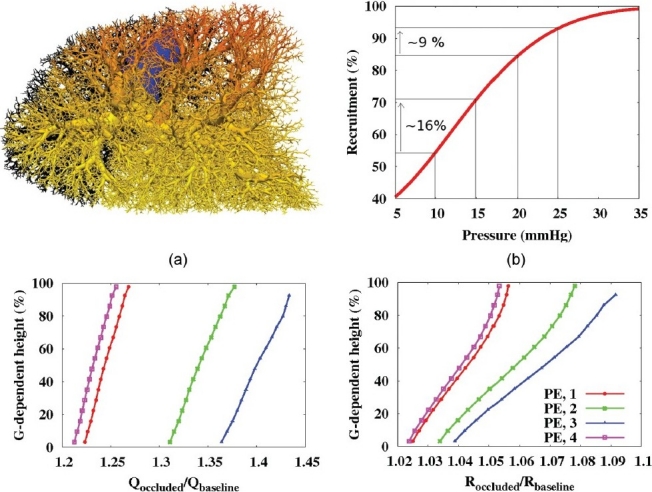
Figure 5.

Flow redistribution after occlusion with 10 mm emboli. (a) Supine model with 1 occlusion (PE, 1), occluded vessels in black, color spectrum represents Qoccluded/Qbaseline (red=1.3, dark blue=1.0). (b) Plot of the capillary recruitment function (Eqn A6). (c) Acinar flow values (Qoccluded/Qbaseline) and (d) capillary recruitment post-occlusion normalized by baseline values (Roccluded/Rbaseline). (b-d) show all 4 potential occlusions. (c,d) Values averaged in 10 mm slices, plotted with respect to gravitationally dependent height (%). All occluded capillary ‘sheets’ removed from this analysis.
