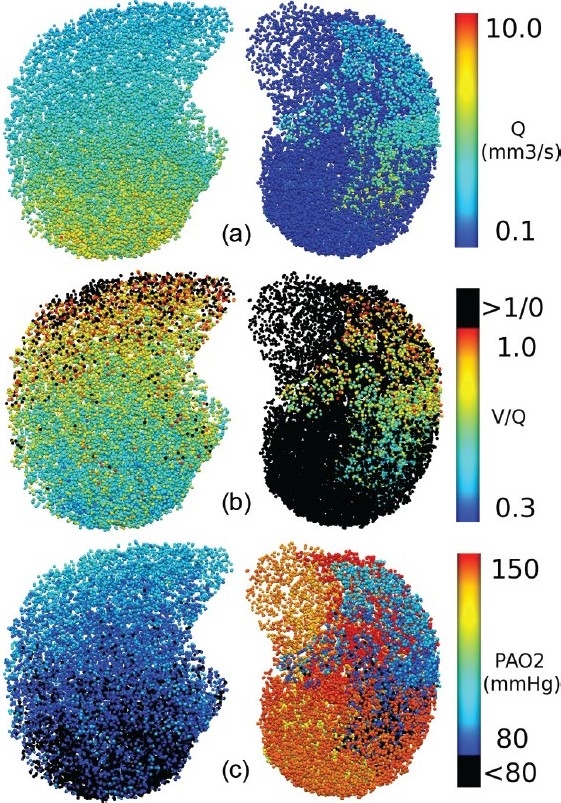
Figure 7.

Acinar values of (a) blood flow (Q, mm3/s), (b) V/Q matching, and (c) PAO2 (mmHg), shown in a transverse section (caudal view) through a supine lung model at FRC with 40% tissue occlusion by multiple 7 mm emboli. The color spectrum ranges are indicated to the right of each image. V/Q >1 in (b) and PAO2<80 mmHg in (c) are colored black to highlight regions of poor perfusion and regions where hypoxic pulmonary vasoconstriction could theoretically be occurring, respectively.
