Figure 2.

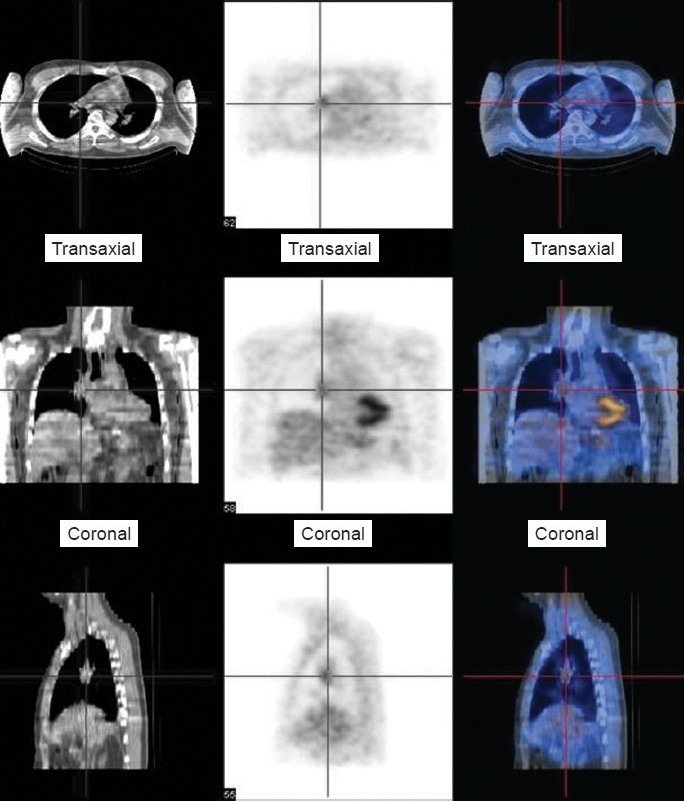
Selected images from 18 FDG-positron emission tomographic study demonstrates increased tracer uptake in the right pulmonary artery (red cross bars) in keeping with active phase of the vasculitic process.

Selected images from 18 FDG-positron emission tomographic study demonstrates increased tracer uptake in the right pulmonary artery (red cross bars) in keeping with active phase of the vasculitic process.