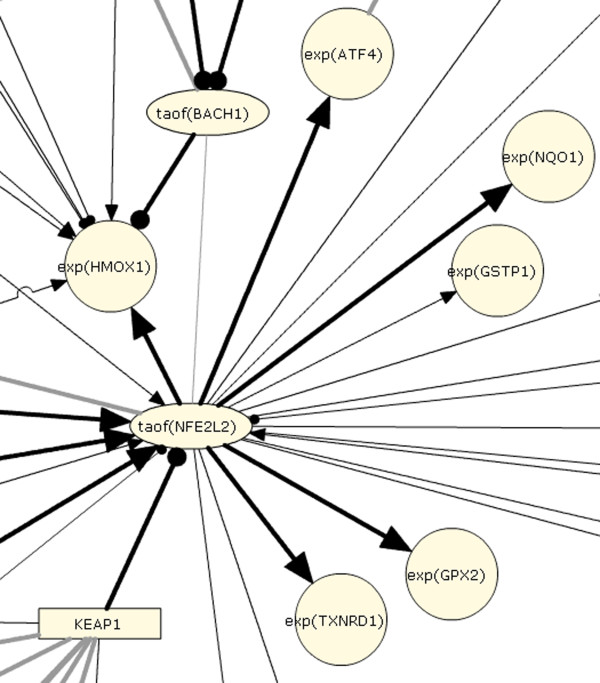
Figure 3.
Network model detail. A portion of the network model surrounding NRF2 (NFE2L2) is shown, including transcriptional regulation by KEAP1 and downstream expression targets. Activating direct causal relationships are shown as dark arrows; inhibitory direct causal relationships are shown as edges ending in a knob.

