Figure 5.

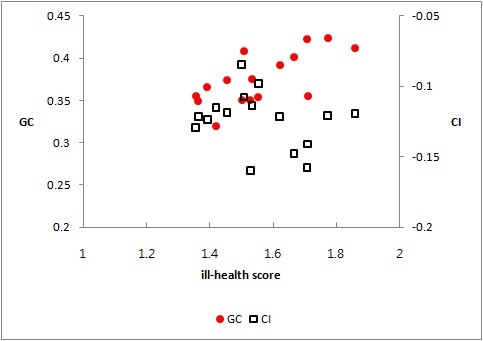
The GC (left) and the CI (right) plotted against ill-health scores. The y-axis (left): The Gini coefficient. The y-axis (right): The Concentration Index. The x-axis: Ill-health scores.

The GC (left) and the CI (right) plotted against ill-health scores. The y-axis (left): The Gini coefficient. The y-axis (right): The Concentration Index. The x-axis: Ill-health scores.