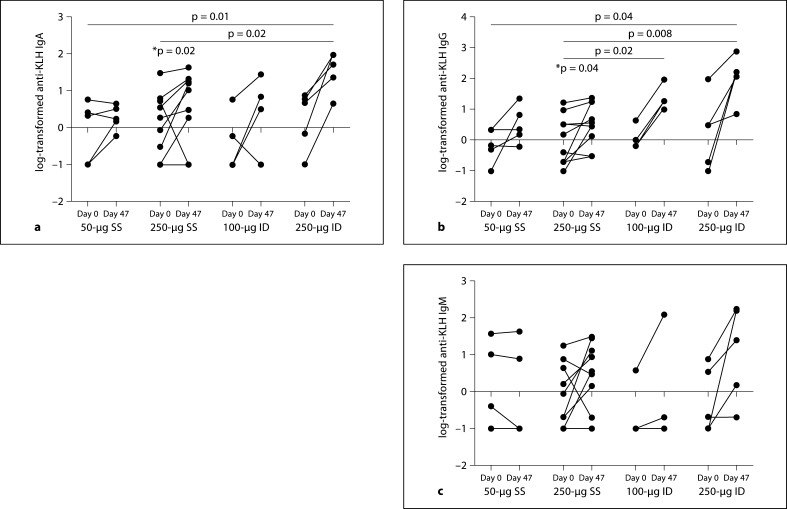
Fig. 1.
Individual subject values at baseline to day 47 in log10 anti-KLH IgA, IgG and IgM. Log10-transformed anti-KLH IgA (a), IgG (b) and IgM (c) by dose and administration group. * The 250-μg SS treatment arm had a statistically significant (p < 0.05) increase in anti-KLH IgA and IgG compared to no response (0) as determined by a signed-rank test. Bars indicate significant differences in the comparison of mean change from baseline between 2 treatment groups as determined by a Wilcoxon test. The p value associated with the comparison is included at the top of the bar. Antibody levels measured at 0 are set to −1 for the log transformation.

