Figure 1.

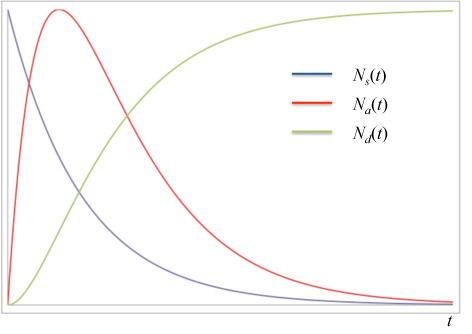
Qualitative behavior of surge (blue), admitted (red), and discharged (green) populations with time as predicted by Equations 10, 12 and 13. Curves are normalized for clarity.

Qualitative behavior of surge (blue), admitted (red), and discharged (green) populations with time as predicted by Equations 10, 12 and 13. Curves are normalized for clarity.