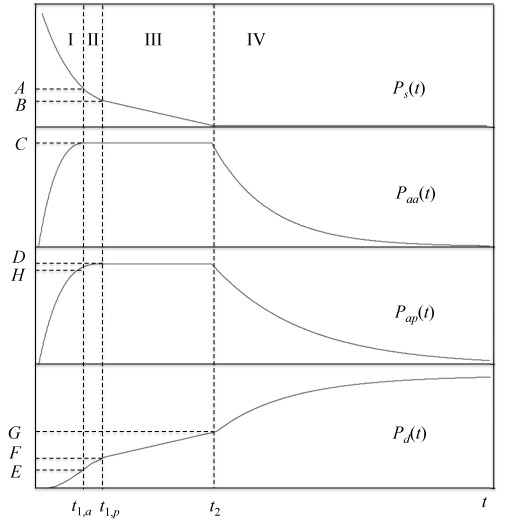
Figure 3.

Behavior of pediatric cohort of the surge (top panel), admissions to adult center (second panel), admissions to pediatric center (third panel), and discharged patients (fourth panel) with time as predicted by the maximum capacity with PTC model, Eqs. 40-50. Uppercase letters indicate boundary conditions for the appropriate differential equations; see text for details.
