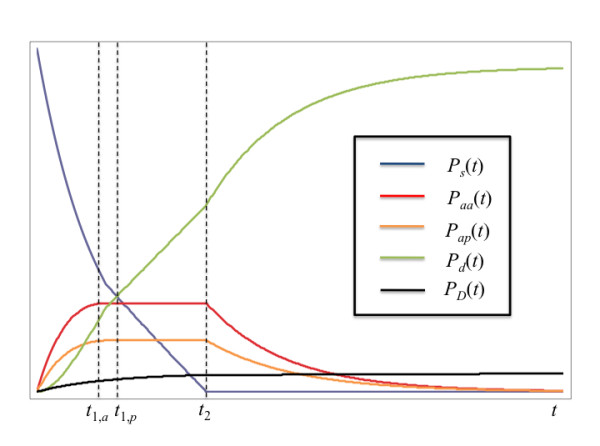
Figure 6.

Qualitative behavior of maximum capacity with PTC model with explicit death rates derived in Appendix B. Blue curve: pediatric surge. Red curve: pediatric patients admitted to adult center. Orange curve: pediatric patients admitted to PTC. Green curve: living discharged patients. Black curve: deceased patients.
